
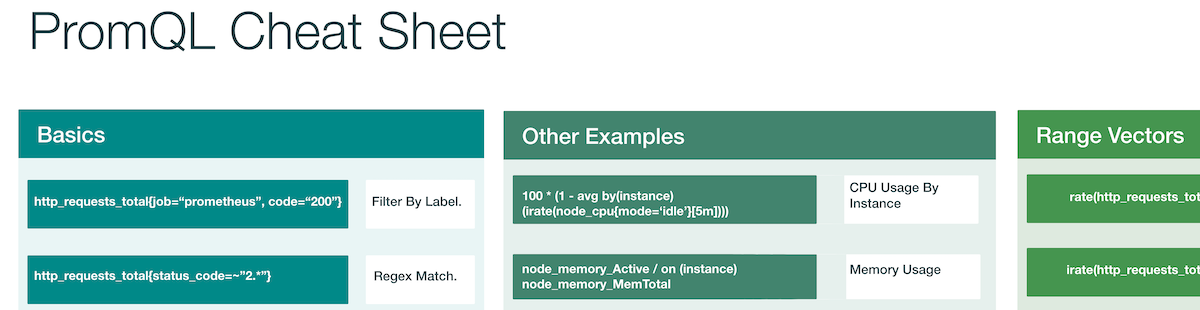

PromQL is the dedicated query language for Prometheus metrics. Use this cheat sheet as a reference for the common queries on Grafana panels.
Updated for 2026. On Logit.io run these against hosted Prometheus in hosted Grafana Explore and PromQL panels — connect the stack with connect to Grafana and panel wiring under Grafana visualizers. Ship series with Telegraf or your other metrics scrapers.
PromQL is the dedicated query language for the metrics and monitoring Stack known as Prometheus. PromQL is well know for having a steep learning curve.
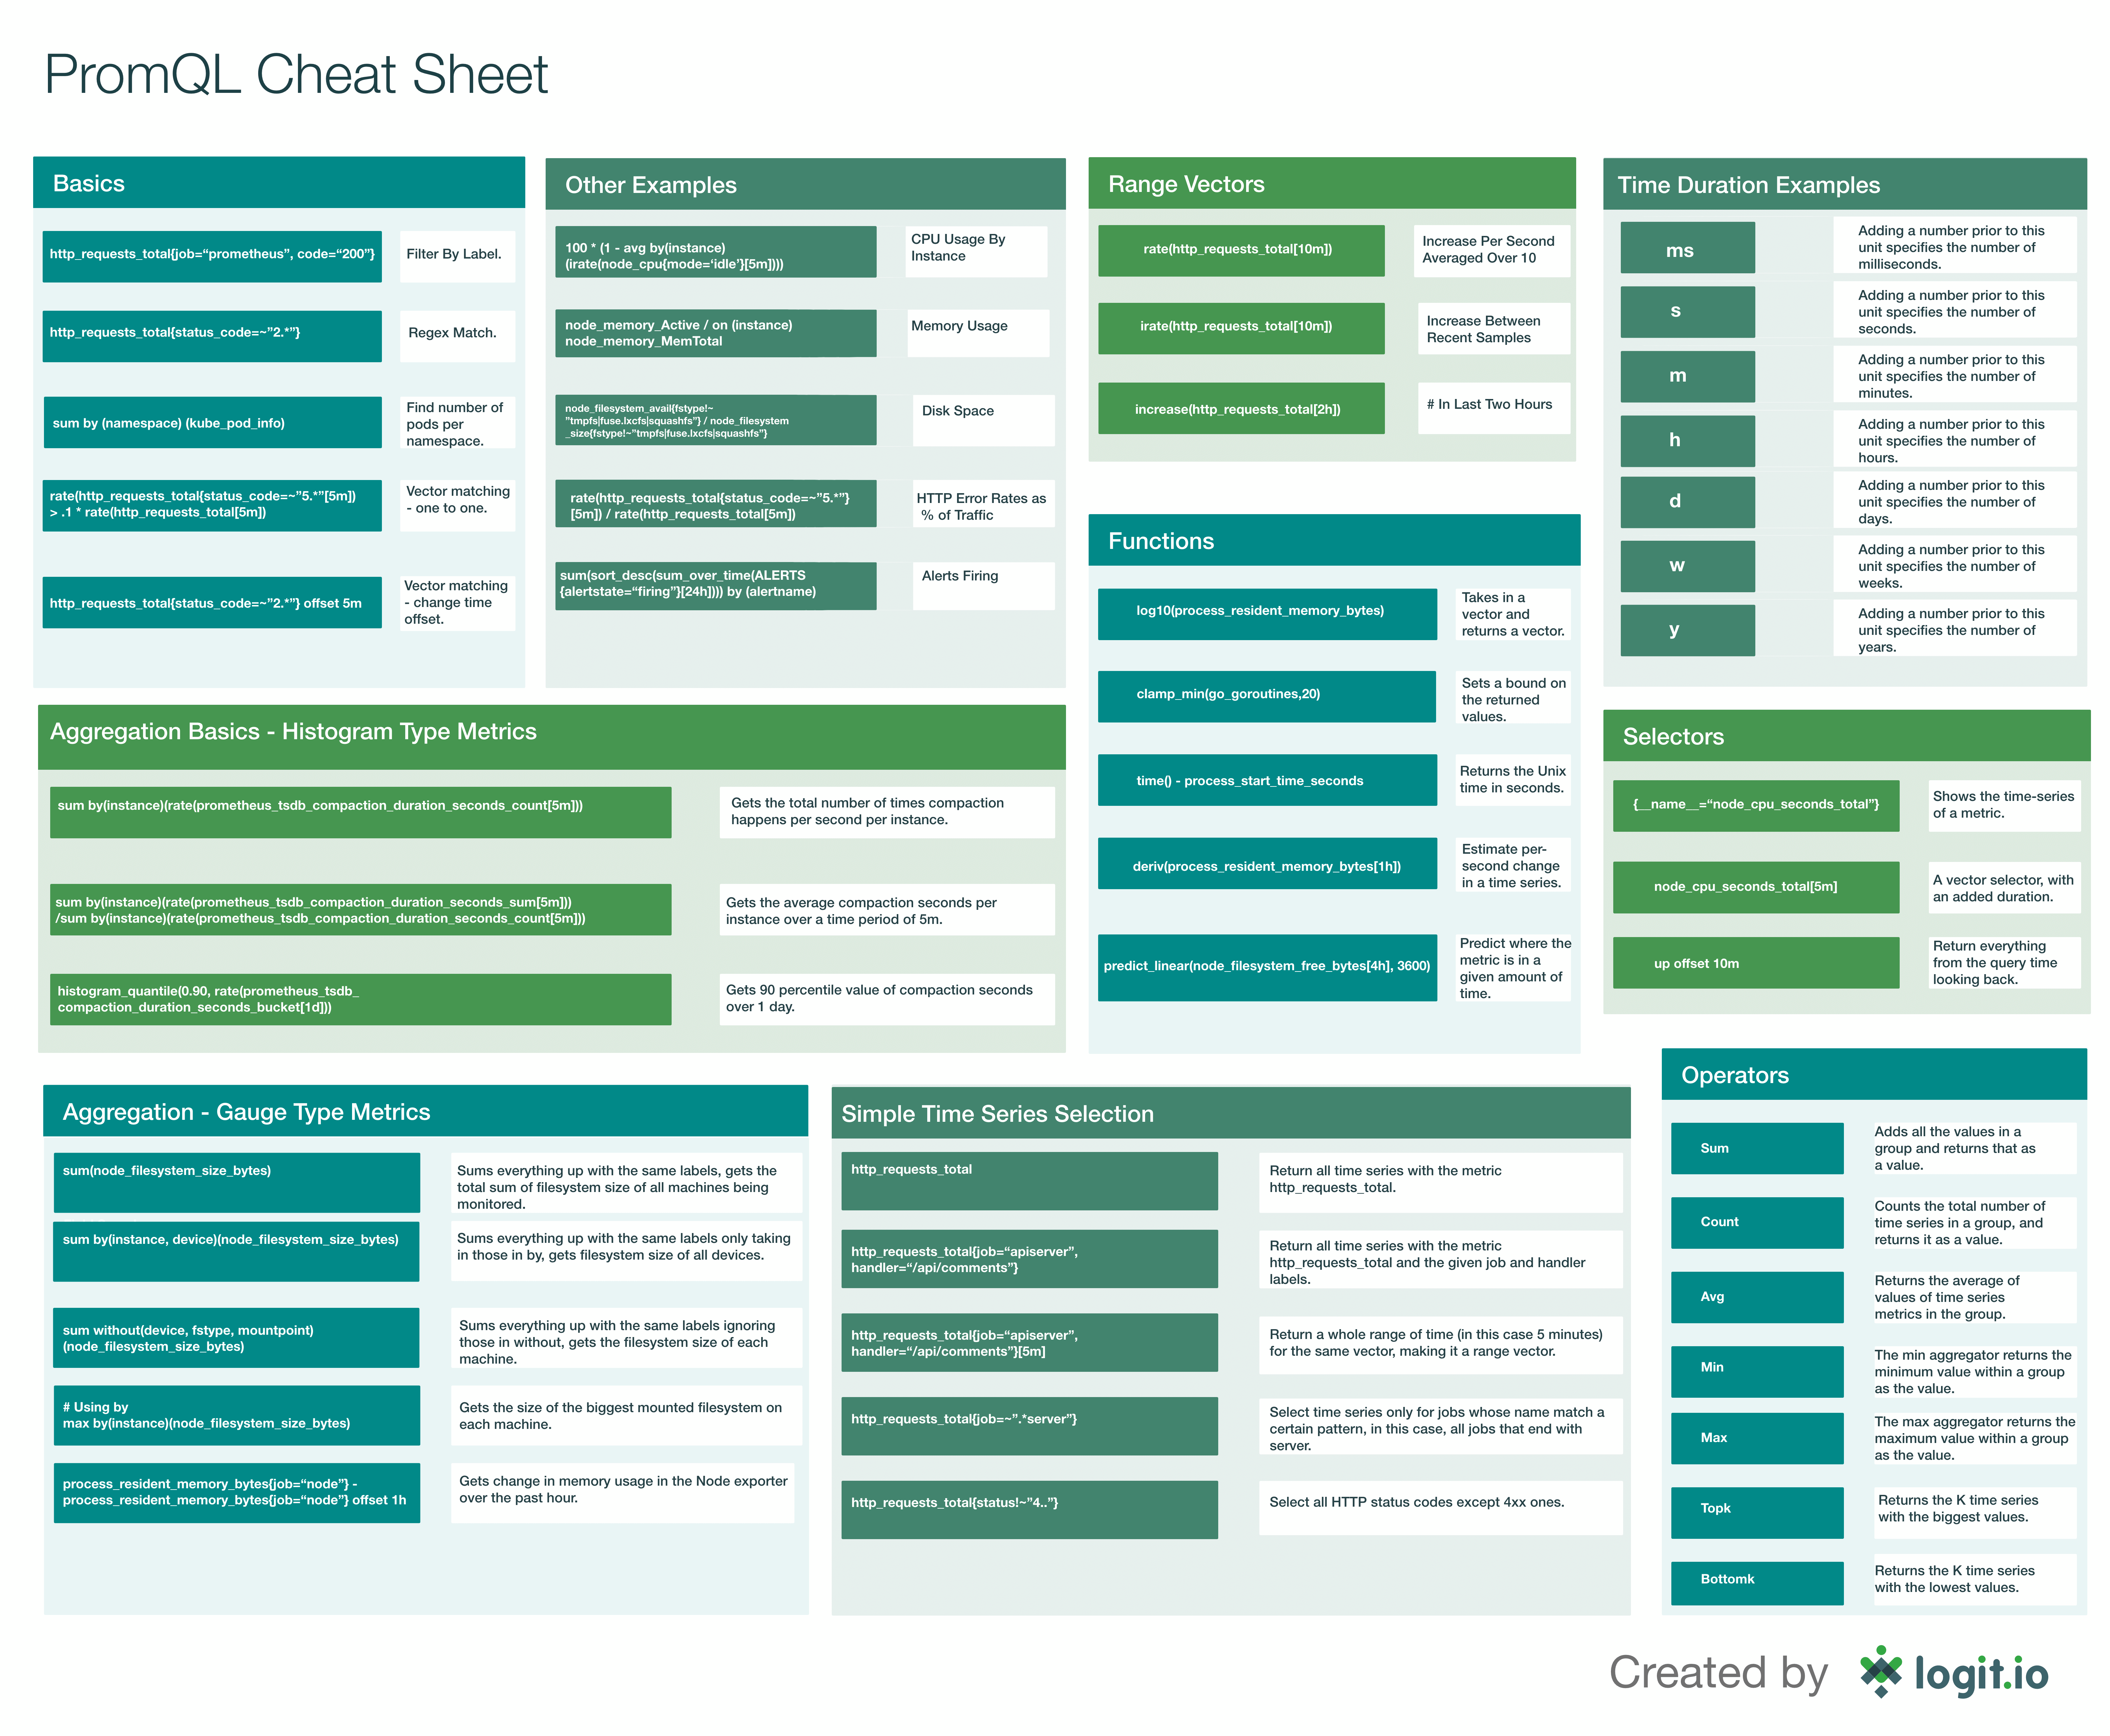
Because of this we've created a helpful cheat sheet as a reference to help you with understanding the most common PromQL queries.
Please feel free to save the sheet below and share it with any team members that you think would appreciate learning some of the most important queries of PromQL.
Unlock complete visibility with hosted ELK, Grafana, and Prometheus-backed Observability
Share via: Twitter , LinkedIn and Reddit.
If you are having issues with scaling Prometheus then the Logit.io managed service for Prometheus is designed to remove operational toll so that you can scale your Prometheus based monitoring and finally perform global querying as well as store metrics for long term retention.
If you enjoyed this cheatsheet about PromQL then why not learn something new by checking out our post detailing CI/CD's meaning?