
Complete Observability Platform Features
Discover our comprehensive suite of observability tools designed to give you full visibility into your infrastructure, applications, and services.
Annual billing · 14-day free trial
Hosted OpenSearch MCP
Query your OpenSearch data from Cursor or Claude Desktop with Logit.io’s hosted, read-only MCP endpoint. No local MCP process to run — enable per stack on Hosted OpenSearch, Log Management, and Custom plans and paste the config into your AI client.
Explore Hosted OpenSearch MCP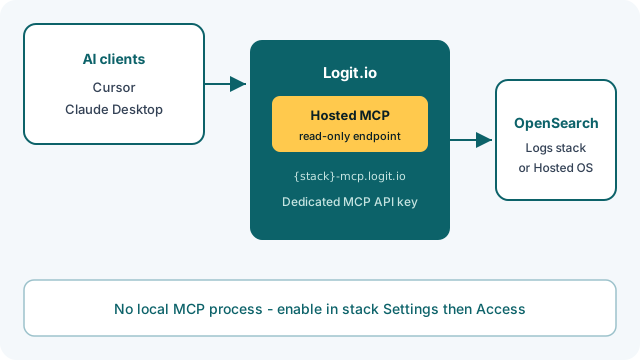
Alerting
Managed ElastAlert 2 with 12 rule types and 45 destinations — Slack, PagerDuty, Microsoft Teams, ServiceNow, Jira, webhooks, SMS, and more. Test rules in the dashboard and optionally automate them via the Developer API.
Explore Alerting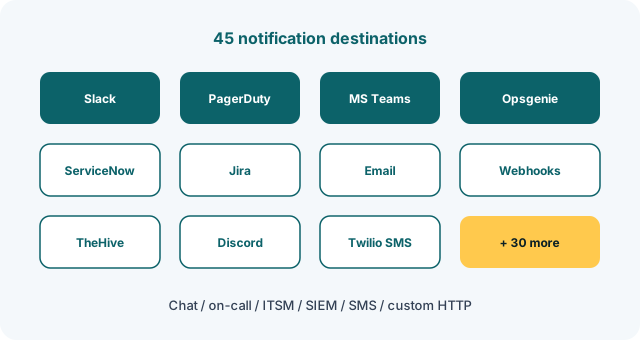
Developer API
Automate stacks, Logstash pipelines, alerting, and ingestion statistics with the Logit.io control-plane API. Authenticate with an API key and generate clients from OpenAPI.
Explore the Developer API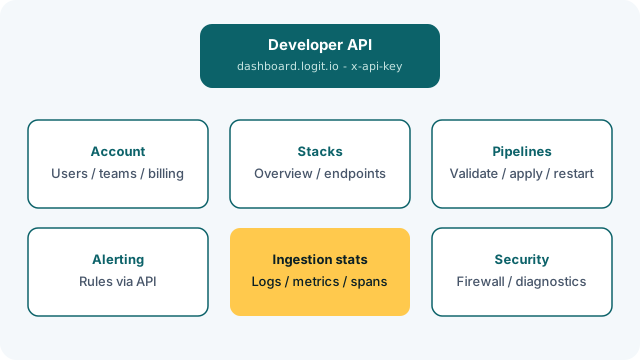
Hosted OpenSearch
Fully managed OpenSearch clusters and Dashboards — RBAC, REST API, Hosted MCP for Cursor and Claude, and predictable per-node pricing. Use the commercial overview when you are evaluating Logit as a managed OpenSearch provider; deep-dive pages cover Dashboards and demos.
Hosted OpenSearch (commercial overview)OpenSearch pricing | OpenSearch Dashboards | Hosted OpenSearch MCP
Hosted Logstash
Use managed Logstash to allow your teams to benefit from having a complete log management platform built for sending, parsing and enriching data at scale and enable your engineers to spend more time where it matters, deploying code and conducting analysis.
The Logit.io Logstash filter editor can be used to quickly transform and enrich your data across preconfigured inputs to turn them into semantic data viewModels. Our Logstash filter editor also fully supports a huge range of custom inputs and outputs.
Perfect for ETL (Extract, Transform, Load) operations, data normalization, and creating standardized formats across diverse data sources. Integrate with your existing infrastructure seamlessly for real-time data processing.
Find out more about Hosted LogstashHosted Prometheus
Logit.io's Managed Prometheus service allows you to remotely store time-series metrics for long term storage and governance. The Logit.io platform also provides a complete in place alternative for locally hosted Prometheus, Thanos and any preexisting federation.
Monitor your infrastructure and applications with industry-standard metrics collection and alerting. Our hosted solution eliminates the complexity of scaling Prometheus while maintaining all the powerful querying capabilities you rely on.
Read More On Hosted PrometheusJaeger as a Service
Deploy Jaeger distributed tracing with zero configuration using our managed service. Get complete visibility into your microservices architecture with end-to-end distributed tracing, helping you optimize performance and troubleshoot issues faster.
Essential for modern microservices architectures, Jaeger helps you understand service dependencies, identify bottlenecks, and troubleshoot latency issues. Our managed solution makes implementation simple with pre-configured collectors and storage.
Explore Jaeger as a ServiceLearn About Distributed Tracing | See Open Source as a Service
Hosted ELK
We understand that while the open-source Elastic Stack stack software is initially free to use and home to many brilliant capabilities, when it comes to having to configure, upgrade & maintain ELK in-house it can be extremely hard to scale operations affordably. Logit.io provides a complete solution to these common issues often encountered when using ELK for log analysis.
Many organizations are turning to managed services such as Logit.io when they find that the costs associated with hosting, customising, and maintaining ELK spiral quickly & prove to be a strain on internal staff.
The complete Elastic Stack (Elasticsearch, Logstash, Kibana) delivered as a fully managed service with enterprise-grade security, automatic scaling, and 24/7 support. Eliminate the operational overhead while maintaining full control over your data.
Find Out More About Hosted ELKHosted Kibana
Without a data visualisation tool like the solution offered by our built-in hosted Kibana integration, then you could quite easily find that reporting on key metrics and gaining a bird's eye view on the health of your operations to be highly ineffective to manage in line with business growth.
Kibana is well suited to numerous use cases and is the preferred tool of choice by SysAdmins and DevOps Engineers globally. It can also easily be used as a replacement for Google Analytics for tracking of on page events and insights key for understanding business analytics and sales metrics.
Find Out More About Hosted KibanaHosted Elasticsearch
As part of our ELK based log management platform we also provide Hosted Elasticsearch. Hosted Elasticsearch enables teams to unlock the full capacity of this powerful search engine while also allowing full access to its complementary tools, Kibana and Logstash.
Our hosted Elasticsearch users enjoy faster cloud infrastructure thanks to a disaggregated NVMe (Non-Volatile Memory Express) storage built for scalability at the lowest possible total cost of ownership.
For real-time big data analysis, NVMe has been shown to provide improved capabilities and is forecasted to become essential to analysts that require near instant visibility of mission-critical operations.
Discover Hosted ElasticsearchEnable Advanced Authentication For ELK
Secure your ELK stack with advanced authentication options. Our platform provides robust security features including role-based access control, SSO integration, and multi-factor authentication to ensure your data remains protected.
Learn More About ELK AuthenticationLive Tail Hosted Logtrail
As the leading managed ELK platform, Logit.io is also home to many of the essential plugins for using the Elastic Stack, including hosted Logtrail for Kibana log viewing. Our managed ELK platform with a built-in Logtrail integration enables you to easily search, filter and define the log events that matter to your organisation as data live streams from your system infrastructure.
Harness Logtrail EfficientlyAudit Log
The Logit.io system and cloud monitoring platform is fully integrated with an internal audit log on both your account and ELK, (Elasticsearch, Logstash & Kibana) Stack level that can be accessed by all users and exported as a CSV or JSON file to be stored on an external system for long term retention free of charge.
By using audit log data to ensure compliant operations you can spot potential bad actors and high alert activities to assist in preventing data breaches before they occur.
Learn More About Internal AuditingHosted Grafana
Experience the best of Grafana without the need to configure and maintain software, manually scale in production or have to provision your own servers by using managed Grafana from Logit.io. Our Managed Grafana platform also integrates with all of the key cloud platforms including AWS, GCP and Azure.
Get started within minutes using our platform and see how the power of managed Grafana, Kibana and Open Search can rapidly improve your reporting, monitoring and overall observability without risking vendor lock-in, data egress fees or not complying with ISO 27001, GDPR, HIPAA or PCI.
Learn More About Hosted Grafana SolutionHosted Jaeger Logging
Enhance your observability with our hosted Jaeger logging solution. Collect, store and analyze distributed traces with ease while maintaining complete control over your data retention and visualization needs.
Learn More About Hosted Jaeger LoggingPrometheus Demo
Experience the power of Prometheus monitoring firsthand with our interactive demo. See how easy it is to collect metrics, create alerts, and visualize your data using our fully managed Prometheus service integrated seamlessly with Grafana.
Try Our Prometheus DemoGrafana as a Service
Deploy Grafana instantly with our fully managed service offering. Focus on creating powerful visualizations and dashboards while we handle all the infrastructure, updates, and maintenance. Benefit from enterprise-grade security, automatic backups, and seamless integration with your existing data sources.
Learn More About Grafana as a ServiceHassle Free ELK Stack Configuration
Setting up and maintaining an ELK Stack can be complex and time-consuming. With Logit.io's managed ELK service, you get a pre-configured, production-ready ELK Stack that's optimized for performance and scalability. Our platform handles all the configuration complexities, allowing you to focus on gaining insights from your data rather than managing infrastructure.
Learn About Our ELK Stack ConfigurationStart your 14-day free trial
No credit card required. Logs from $25/mo.