
Fully Managed OpenSearch from $45.52/node/mo
Fully managed OpenSearch clusters and Dashboards — RBAC, REST API, and hosted MCP for Cursor and Claude. Predictable per-node pricing from $45.52/node/mo. 14-day free trial.
Trusted by engineering teams worldwide



















































Fully managed OpenSearch on Logit.io is hosted OpenSearch you provision as its own stack — search, Dashboards, security plugins, and APIs — without running masters, data nodes, upgrades, or patching yourself.
Use it when OpenSearch is the product: application search, custom indexes, security analytics, or multi-tenant Dashboards. Need shipper-first log observability with Logstash instead? Start with log management. Node pricing and tiers live on the OpenSearch pricing page (from $45.52/node/mo on DEV-1-1-10).
Start a 14-day free trial · Book a demo · Compare node pricing · Hosted OpenSearch docs
Logit Hosted OpenSearch vs self-hosted
| Capability | Logit.io | Self-hosted OpenSearch |
|---|---|---|
| Cluster ops | We run hosting, upgrades, and day-two care | You size, patch, and babysit nodes |
| Pricing model | Transparent per-node plans from $45.52/node/mo | Cloud VMs + storage + engineer time (often opaque) |
| Security & access | RBAC, encryption, multi-tenancy Dashboards | You wire security plugins and tenancy |
| APIs & AI clients | REST API + optional RBAC user creds + Hosted MCP | You expose endpoints and run local MCP yourself |
| Alerting | Managed Alerting — 12 rule types, 45 destinations | You operate ElastAlert / monitors yourself |
Why teams buy Hosted OpenSearch on Logit.io
Self-hosting OpenSearch looks cheap until someone owns rolling upgrades, disk pressure, shard allocation, and security plugins at 2 a.m. Logit.io runs the cluster so your engineers keep building indexes, queries, and Dashboards — not fighting JVM heaps.
You get production OpenSearch with Dashboards, fine-grained access controls, scheduled reporting, and the same REST surface your clients already expect. Pair with managed Grafana on the same account when metrics need a first-class UI.
Who Hosted OpenSearch is for
Choose a dedicated Hosted OpenSearch cluster when success means provisioning a search/analytics engine: application search, product catalogs, custom mappings, or multi-purpose indexes that are not primarily a log pipeline.
Choose a log management stack when success means shipping infrastructure or app logs through Logstash, exploring them in Discover, and alerting on operational patterns — OpenSearch still powers search, but the product shape is observability-first. See Log stack vs Hosted OpenSearch for the decision guide.
Many teams run both: logs on Log Management, a second OpenSearch stack for product search. Do not duplicate the same log stream across two stacks just to “have OpenSearch.”
Dashboards, RBAC, and multi-tenancy
OpenSearch Dashboards ships with the cluster — Discover, visualizations, notebooks, and scheduled PDF/PNG/CSV reports. Multi-tenancy keeps index patterns, dashboards, and drafts in role-scoped containers so teams share a cluster without sharing every view.
Security plugins cover node-to-node encryption and role-based access with index- and document-level restrictions. Private tenants support least-privilege drafts before you publish to a wider audience.
REST API, user credentials, and Hosted OpenSearch MCP
Call the OpenSearch REST API on your stack at https://{stack-id}-es.logit.io with credentials from Settings → Endpoints. On Business and Custom plans, enable OpenSearch API (user credentials) at {stack-id}-es-user.logit.io so people and CI inherit Teams OpenSearch roles — the same RBAC model as Dashboards.
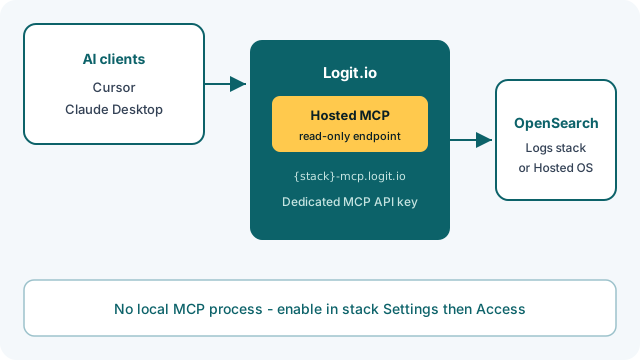
Query live indexes from Cursor or Claude Desktop with Hosted OpenSearch MCP — a managed, read-only MCP endpoint ({stack-id}-mcp.logit.io) with a dedicated key. No local MCP process. Available on Hosted OpenSearch, Log Management, and Custom plans.
Alerting and day-two operations
Monitor cluster data and route notifications where your team already works. Logit.io’s managed Alerting runs ElastAlert 2 with 12 rule types and 45 destinations — Slack, Microsoft Teams, PagerDuty, ServiceNow, Jira, email, SMS, webhooks, and more. You can also use OpenSearch Alerting monitors in Dashboards.
Capacity, upgrades, and hosting stay on us. Engineer-backed support helps with onboarding, custom configurations, and tricky queries — not a ticket black hole.
OpenSearch pricing
Hosted OpenSearch is priced per node. Public “from” figures come from the developer tier table — currently $45.52/node/mo for DEV-1-1-10 (10 GiB Local NVMe). Size nodes on the published OpenSearch pricing page rather than third-party roundups.
Compare node sizes, storage, and CPU on OpenSearch pricing. Prefer a full logging pipeline with Logstash? See log management pricing from $25/mo. Want a walkthrough before you size nodes? Book a demo or start the 14-day free trial.
Key benefits
Provision production OpenSearch in minutes — hosting, upgrades, and day-two care stay on Logit.io.
Canonical node tiers on /pricing/opensearch/ from $45.52/node/mo — not usage-meter surprise bills.
OpenSearch Dashboards with multi-tenancy, encryption, and index/document-level access controls.
Full OpenSearch REST API; optional user credentials on Business/Custom; Hosted OpenSearch MCP on Hosted OpenSearch, Log Management, and Custom.
ElastAlert 2 with 12 rule types and 45 destinations — Slack, PagerDuty, Teams, ServiceNow, Jira, SMS, webhooks.
Dedicated clusters for search/analytics workloads; log management when you need shipper-first observability.
Companies Feel The Difference When They Use Logit.io
“One thing is certain when operating in the startup space, a strict budget. Before we make any purchase decision to use a SaaS Log Management platform, we need to validate the benefits of the platform and more importantly the team behind the platform.”
“Logit.io's customer support team stood out. Right from the beginning, the Logit.io team was there to answer questions and walk us through the process.”
Ready to run OpenSearch without owning the cluster? Start a 14-day free trial, book a demo, or size nodes on the pricing page.
Start free trial · Book a demo · OpenSearch pricing · Hosted OpenSearch MCP · MCP quickstart
Start your 14-day free trial
No credit card required. Log plans from $25/mo and dedicated clusters from $45.52/node/mo.